As you probably know SQLabs is busy developing the next generation of our sqlite based server (to be released in late January).
We want it to be rock solid and among with some unique and powerful features we are investing a lot of energies into an efficient testing process and this blog post is about some it.
The first thing I personally developed is a MacOS X 10.6 only feature (it will be used only internally for testing purpose) and it’s a debug module that helps us to track down all the memory related issues. I know that MacOS X already comes with some powerful memory debugging options but we need something unique. A server must be a rock solid product, it must have zero crashes plus it cannot leaks memory so I decided to developed a custom C module just to keep track of all memory allocations, deallocations, double frees and leaks and more important it gives us a way to track down the exact cause of the memory issues.
Standard tools are able to report some cryptic information like “you are leaking 800 bytes with a pointer 0x84332089”. But we need to know exactly where that pointer has been allocated. Our module has been developed to reply exactly to that question. When a block of memory is originally allocated we save (among other information) the exact program stack trace, so when we need to find out more information about it we can easily read the saved stack trace.
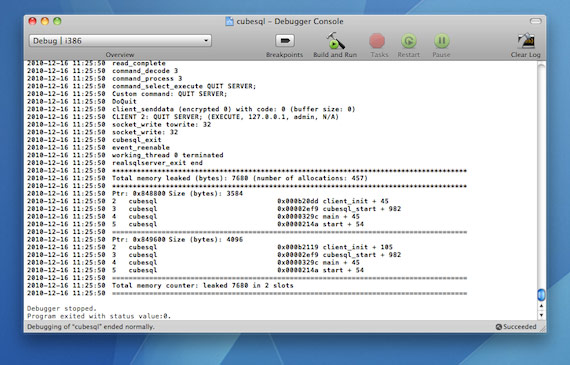
As a real world example, I tried a pre-beta version of the new server, I connected some clients, I performed some sql operations and the I closed the server. Here you go a debug output:
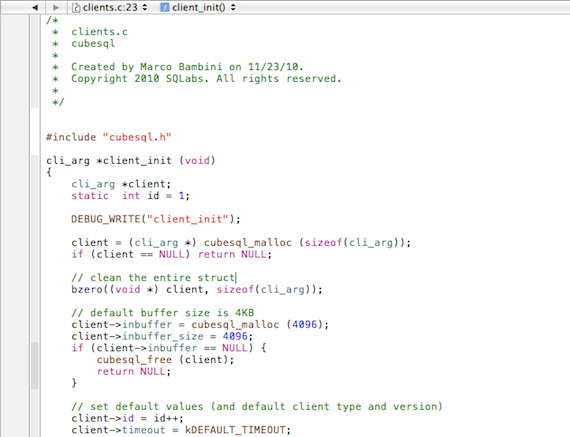
As you can see it seems that this release it leaks 7680 bytes and both are allocated inside the client_init function. One is 3584 bytes long and the other is 4096 bytes long. A quick view at that function:
and we was able to fix the memory leak (automatically reported) in a couple of minutes (we forgot to free client->inbuffer and client itself when it disconnects).
It’s a real powerful tool and it uses some powerful features that MacOS X gives to the developers.
Memory related issues are very important to fix but equally important are the crash that can occurs during the program lifecycle. Some crashes are due to logical issues and sometimes are difficult to discover but there are other crash categories that can be easily fixed and automatically discovered. This is where XCode and Code Coverage comes in our help.
I created a new XCode target (I duplicated my Debug target) and I named it CodeCoverage. Then I set Base SDK to MacOS X 10.6, in the Other Linker Flags I added -lgcov then I checked the Generate Test Coverage Files and the Instrument Program Flow checkboxes.
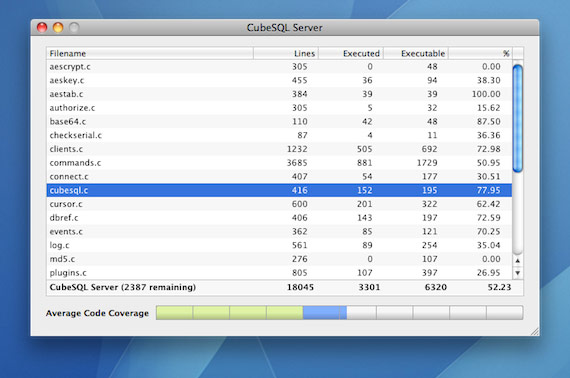
At this point when I run the server some special files are written inside the Objects-normal folder full of information about which code is executed, how many times and so on. In order to better understand and manage all this useful data I developed a custom REALbasic application that is able to automatically execute the gcov command line utility on that folder and is able display in a nice GUI the overall collected information. Final result looks like:
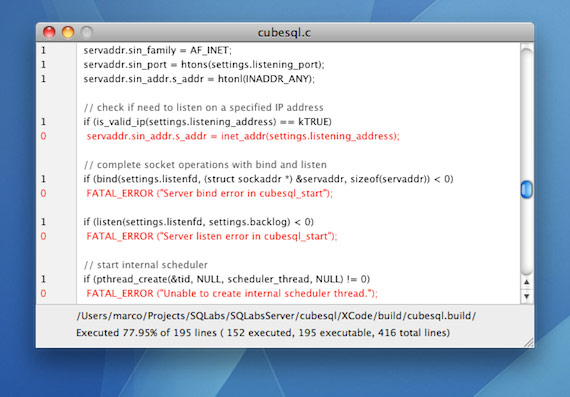
It’s a screenshot from an early pre-beta release but you can see that with our test we was already able to touch more than 50% of the server’s code without a crash. This does not prevents from logical errors but for simple crashes it’s a very powerful tool. With my app when you double click on a file name inside the listbox you can examine that file in more detail:
For every line inside the file you can see how many times it has been executed and in red is reported a line of code never executed. You can then use that information in order to modify the test to try to increase code coverage.
Someday I could also release my app.
Hope that the information posted in this article can be of some help to someone.


About The Author: Marco
More posts by marco